High Performance Environment Delivers New Intelligence Capabilities And Supports Wide Market Adoption Strategy
VANCOUVER, BC – July 25, 2022 – Quini® (www.quiniwine.com), the leader in wine consumer sensory data and analytics solutions today launched its next generation platform for wine producers and industry stakeholders. QUINI DATA™ 2.0 leverages Quini’s growing consumer wine tasting and rating sensory data set, unique data capture and wine tasting event management software applications, consumer tasting panel network and machine learning algorithms to deliver deep, rich insight that enable better informed, faster decisions.
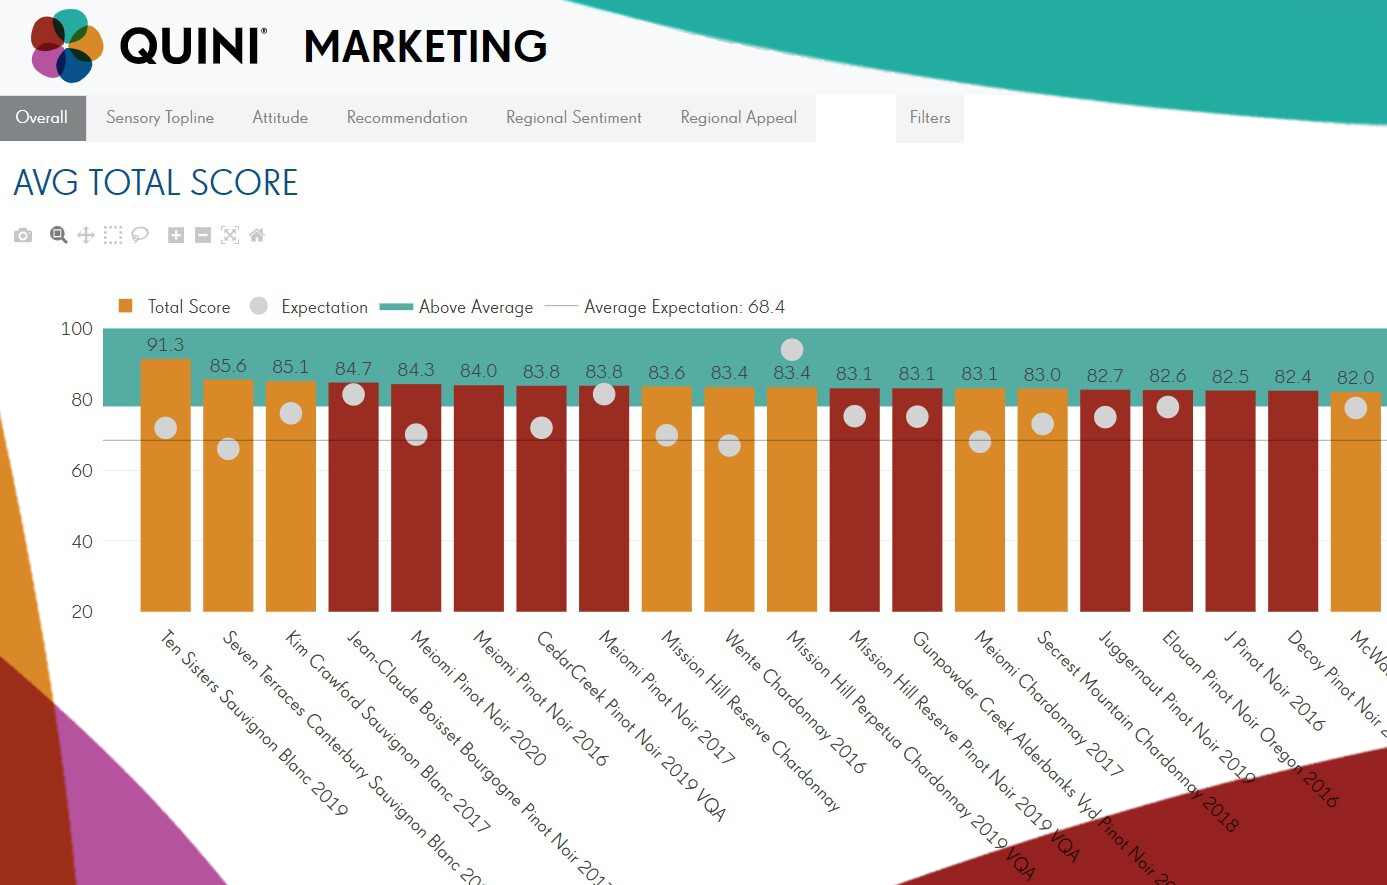
Fig 1. Screen Shot of the QUINI DATA MARKETING Dashboard Overall
“QUINI DATA 2.0 is a proud milestone for Quini, our product management, data science and software development teams. The passion, commitment and tireless work bring to life Quini’s vision for accessible consumer sensory data for winery professionals across business functions,” said Roger Noujeim, Quini’s CEO.
With today's launch, Quini has transitioned away from use of third party data visualization software, eliminating all related licensing costs. The new, proprietary environment enhances performance and user experience, improves design flexibility and security, and enables Quini to grant user licenses widely to support the company’s market adoption and expansion strategy.
QUINI DATA 2.0 offers simple, user friendly analytics to answer business, marketing, sales and product questions, as well as advanced dashboards for Business Intelligence and Innovation professionals.
Added Noujeim: “ Anyone at a winery who can benefit from access to consumer sensory data should and can now have that access. The new QUINI DATA 2.0 platform enables a data-driven culture. A culture that values consumer insight based planning, risk reduction, pre-emptive intelligence and action, and success optimization.
QUINI DATA EXECUTIVE™ with MOBILE ACCESS
QUINI DATA 2.0 incorporates a new analytics dashboard designed to give the busy executive topline consumer insight about a product, at a glance. Also accessible via mobile, the dashboard enables wine professionals to get answers conveniently on-demand, such as for meetings and presentations.
“We recognize that busy executives don’t always have time to dig deep into data. Product analysis at a glance, on a single screen via mobile, enables the professional to be better informed with consumer intelligence, where and when they need it.”
Fig 2. Screen Shot of the Mobile QUINI DATA Dashboard EXECUTIVE
Fig 3. Screen Shots of Two Mobile QUINI DATA Dashboard EXECUTIVE Chart Components
“Wine professionals can now instantly gain actionable perspectives on a product, in a single dashboard, much like analyzing a public company’s stock. Just select a wine and EXECUTIVE provides the answers,” concluded Noujeim.
QUINI DATA 2.0 encompasses multiple complimentary analytics dashboard clusters to support the various business functions in a winery. This includes marketing, business intelligence, wine making and innovation teams, consumer insight managers, direct to consumer (DTC) and wine club groups.
Fig 4. Screen Shot of the QUINI DATA ADVANCED ANALYTICS Dashboard Spider
Wineries engage Quini to collect consumer data on products relevant to their business, to solve critical business and product questions. Leveraging Quini’s national consumer wine tasting panels, data capture software and real-time analytics, Quini ensures the data is soon accessible for clients, on-demand.
For a demonstration of QUINI DATA 2.0, or to request high resolution images, please email Quini at info@quiniwine.com.
ABOUT QUINI
Quini is the leader in sensory data and technology solutions serving the wine industry. Privately held, Quini is headquartered in Vancouver, BC. Quini’s investor group includes OKR Financial (www.okrfinancial.com) and private investors.
###
Quini’s growing roster of winery clients know that success is achieved with information.
Data is intelligence. A means to an edge. The advantage a wine brand needs to gain market share and win against competitors. To target a market more effectively, to the right audience, at the right price, at optimal margins. To reduce risk, pre-empt issues and ensure cash and critical assets are wisely invested. To help sales teams pitch with unbiased data and facts to support the brand story, when everyone else too has a story.
Data is deep knowledge of your customer. A way to their hearts that builds loyalty and affinity for the brand.
The path is to ask your consumers the right questions, and listen. Intently, regularly.
This is why more wineries are increasingly relying on Quini data. Sensory and qualitative. To get more accurate answers to business, marketing, sales and product questions, faster. To pre-empt issues before the big dollars are spent. To figure the price elasticity of a product when inventory is low and upside seems capped. To gauge if smoke from wild fires has terminally tainted crops or if consumers actually enjoy the flavour.
QUINI DATA™ clients realize that more effective marketing and budgets must today incorporate a market research component. That teams must have the right skillset on board. Appreciating that research is critical to on-going decision making, not an afterthought. A reality big CPG and large winery brands figured decades ago.
In a nutshell, here is what QUINI DATA is (watch product video).
NATIONAL CONSUMER WINE TASTINGS
We collect data by conducting in-person, virtual, guided and self-guided wine tastings across North America and Australia, using our proprietary Quini wine rating application. We then use proprietary algorithms and machine learning to analyze the data and extract the information you require, for your target audiences and markets, in near real-time.
BLIND & REGULAR TASTING DATA
Our technology enables us to hold both blind and regular tastings. Blind tastings provide consumer sensory feedback that’s not influenced by label or price point, while regular tastings also provide insights on brand/product expectations and price sentiment.
DATA FROM DIFFERENT GROUP SIZES
Perhaps you want to reinforce a business decision with a relatively small group equivalent to 3 traditional focus groups of around 20 wine drinkers. Or you need to pull the trigger on a major business strategy, and need 100, or 1,000, consumer opinions. Quini easily scales to meet demand, and delivers results in near real-time.
RICH SENSORY & ATTITUDINAL DATA
Quini delivers value unlike any other solution. Through our proprietary platform, we gather 30+ sensory and attitudinal data points on every wine tasted. You’ll have precise details at your fingertips, including sweetness, tannins, alcohol and acidity, color, flavor, aroma, price sentiment, and willingness to recommend a wine. Each characteristic is color-coded so your team clearly sees what’s working, and what needs to improve. Through the depth and consistency of Quini Data, along with our in-house algorithms, you can also discover commonalities in consumer perceptions, helping you make better decisions, reduce risk and direct both resources and investments with greater precision.
QUALITATIVE DATA
For months now Quini has been providing qualitative studies as a valuable add-on service too. At times a winery may want to evaluate a label versus another. Study brand awareness, understand consumer perception and sentiment. Or measure the market share a new product can grab from competitive products. Price elasticity studies also provide significant information to drive your pricing strategy. In short, customized in-person and online surveys to answer virtually any question a winery executive might have.
To set up a product demonstration with our sales team, please email us at sales@quiniwine.com.

Purchase Intent Skews Toward Cork Closures - Wine Product Quality Perception is Equal
The subject of closure alternatives to cork still ignites passionate debate in wine industry circles. For good reason. A number of factors come up, including cost vs. benefit, effect on product quality, brand perception, the environment and critically, impact on sales.
The reality is that we have seen numerous brands launch screw cap wines in recent years, many to much success.
The impact of alternative closures on sparkling wine, however, remains somewhat unclear. A Champagne without the traditional cork? Never, traditionalists say.
To answer the question, at least partly, we looked at the bottlecap option on a sparkling wine and put it to consumers at a Quini sensory wine tasting.
A most interesting finding was on quality perception. Shown images of the same wine brand, side by side with the different closures, a traditional cork and a bottlecap like those we see on Coca-Cola bottles, consumers said the wine with the bottlecap was of equal quality (41%) or of superior quality (4%).
The critical question was around how the two closure alternatives impact purchase decisions. So we asked, "when buying sparkling wine, are you more likely to select a product that has a cork type cap as opposed to one that features a pop-like type cap?"
The bottom line was that the vast majority of consumers surveyed would select a bottle with a cork closure as opposed to a bottlecap type closure. Even tough wine quality perception was equal, with a slight favour towards a bottlecap closure.
Specifically, 68 percent of those surveyed said they would select a wine with a cork closure. 22 percent prefer a bottlecap and 11 percent skipped the questions.
The survey generated additional insight on sparkling wine purchase frequency and dollar per bottle investment.
57 percent of the audience said they typically spend between $11 and $25 on a bottle of sparkling wine, and 32 percent spend $26 to $50. Only 8 percent spend between $51 nd $75 per bottle.
If you have a business question you'd like Quini to include in upcoming consumer tastings in the United States or Canada, please drop us a note at info@quiniwine.com.
To be one of the first to hear of new data releases from Quini, follow us at @quiniwine on Twitter, Instagram, Facebook, LinkedIn and Youtube.
For years the wine industry has tried to figure out the next generation wine consumer. Millennials, specifically, are an important cohort that is larger than the baby boomer generation on whose shoulders the industry flourished. Unless millennials embrace wine in a more significant way, the industry’s struggle to grow will likely persist.
A new Quini wine consumer sensory report sheds light on what the North American millennial wine drinker likes and dislikes.
The report, delivered as an interactive analytics experience rather than the traditional verbiage plus chart images format, allows for filtering data in a number of ways including by blind or non blind tasting, geographic region, gender, drinker wine experience, varietal, wine type, winery or product.
Here are some key insight from the report, titled MILLENNIALS – Sensory Study of Young Wine Consumers, North America, 2022.
FEMALE CONSUMERS HAVE LOWER EXPECTATIONS OF WINE PRODUCTS – Female millennials are almost twice as likely to refrain from setting expectations on a wine, than male drinkers. They also have lower expectations overall, of a wine.
AUSTRALIA REIGNS – On average, wines from Australia get rated at the top by millennials, albeit marginally ahead of United States wines. New Zealand wines rank third.
COUNT MORE ON MALE DRINKERS TO SPREAD THE WORD – Male millennial drinkers, on average, are slightly more open to recommending a wine, than young female drinkers.
FLORAL NOTES ARE KEY TO TASTE PREFERENCE IN RED AND ROSE WINES – Floral forward taste impression is associated with higher mouth appeal average scores by millennials for red and rose wines, but not for white wines.
MORE FEMALE MILLENNIALS PARTICIPATE IN QUINI DIGITAL WINE TASTINGS – Of eleven major US and Canadian markets included in the analysis, more women attended Quini digital wine tastings than men did. In nine markets, the ratio of female wine tasters was between 51 percent to 70 percent. Five of those cities boasted a higher than 60 percent female to male ratio.
IN RED WINE, CHEESE, YEAST, SHERRY, AGED AND FRESH VEGETAL FLAVOURS NOT MILLENNIAL FAVOURITES – Other flavours that millennial drinkers often associate with lower red wine ratings on Quini include butter, prepared vegetal, black pepper and mushroom, among others.
WHITE WINE DRINKERS FAVOUR NOTES OF WALNUT, CHOCOLATE, SHERRY AND BERRY – Other preferred notes include hazelnut, butterscotch, orange blossom, woody and anise, among others.
IN RED AND ROSE WINES BLENDS RANK HIGHER THAN SINGLE VARIETAL WINES – The top two rated varietals in the red and rose categories are blends. In the white wine category, the top two are single varietals, namely Muscat Ottonel, followed by Riesling, driven mostly by male drinker preference. Notably, when isolating female drinker tasting data, Riesling drops out of the top ten most preferred white wine varietals.
METHODOLOGY
We analyzed sensory and attitudinal feedback from nearly 600 millennial consumers in the United States and Canada. The group included people who drink wine regularly but also those relatively new to wine. The analysis covers over 200 different high volume wines and nearly 6,000 individual Quini wine reviews completed by Quini wine consumer panelists using the Quini wine tasting and rating application. Data coverage included multiple metro markets, namely Seattle, Los Angeles, Tampa, New York, Chicago, Phoenix, Houston, Boston, Toronto and Vancouver.
The report looks into market leading high volume brands including Josh, J., Meiomi, Ferrari Carano, Decoy, Talbott, 19 Crimes, Twisted, Carnivor, Apothic, La Marca, Cambria, Kendall Jackson, Chateau Ste. Michelle, 14 Hands, Gray Monk, Jacob’s Creek, Mission Hill, Open and many others.
The report is delivered in an interactive analytics dashboard format that features extensive data filtering and charts.
MEDIA RELATIONS
Media may obtain further details and data breakdowns by contacting Quini media relations at info@quiniwine.com.
Content and images may be reused with credit to Quini®.

Community Profile Impact on Decision Making in The Wine Making Business
It is interesting to look at wine consumers in specific areas of the world, down to the state or city level, to see how drinker tastes and impressions of wine differ.
When we analyze sensory data and consumer profiles in Scottsdale, AZ, we find that drinkers there identify with an extremely low level of alcohol in major Chardonnay household name products. Do they prefer them more if so, or not?
When this insight is combined with a deeper dive on age groups and gender preferences, and a competitive product benchmark set, the insight can directly influence some of your key business, product style, distribution (e.g. explore additional markets that are similar in their consumer profile to Scottsdale) or marketing and positioning decisions. It can also provide stats your sales team can take to the trade to prove your product superiority or advantage, versus key competitors and brands, based on third party verified research.
The full interactive analytics report, Chardonnay, North America 2021 is now available at this link for US $1395.00. Covers 44 popular Chardonnay wines and 4146 consumer reviews with sensory and behaviour data included. Extreme value for winery teams to make more profitable decisions. Every tweak in the right direction counts.
Take a look at a few of the other findings covered in this report, in this interactive preview.
Consumer Feedback Reveals Direct Correlation Between Wine Tourism, Perception and Growth Potential
As a company that specializes in wine consumer sensory data and analytics for wine producers, we regularly get together with wine consumers to taste and rate wines. Our tastings include a sensory wine review experience using the Quini digital wine tasting experience, and depending on client requirements, we also capture consumer opinion about important product concerns or industry issues.
We hosted a tasting in Vancouver just this past December, to the equivalent of about three focus groups. 25 regular Vancouver based wine drinkers who purchase and consumer wine at least twice each month and who are overall interested in wine.
While the primary goal was to evaluate consumer taster opinion of a variety of British Columbia wines, our clients were also wanted to gauge consumer interest in visiting the Okanagan Valley in 2022, drinker general opinion of Okanagan wines, and BC wine brand awareness and recall.
Here are the findings:
The top six Okanagan wine brands recalled, in order, were as follows. If you wish to get the full list and ranking, drop us an email at info@quiniwine.com.
1- The View
2- Mission Hill
3- Dirty Laundry
4- Burrowing Owl
5- Monte Creek
6- Quails’ Gate
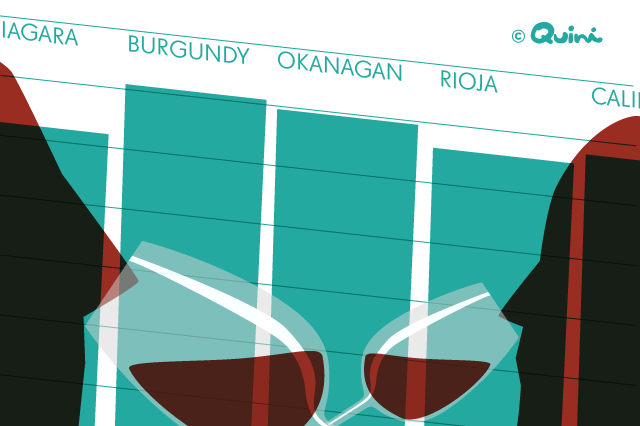
When asked how they felt about the quality of Okanagan, BC wines, 64 percent of participants said ‘positive’, 32 percent said ‘neutral’ and 4 percent had a ‘negative’ sentiment. In all, the feedback indicated a positive feeling but unveiled a significant opportunity for growth, by improving consumer perception of BC Okanagan wine products.
When compared to some of the most competitive wine regions in the world, the Okanagan Valley, BC ranked second to Burgunday, France and marginally ahead of California. Wahington State, Rioja, Spain, and Niagara, Ontario followed, in order.
Of the 25 respondents to the questionnaire, 16 (64%) consumers had been on a wine tasting in the Okanagan before, versus 36 percent who had never been.
When asked if they plan to visit Okanagan wineries in 2022, 48 percent of all participants said yes. 36 percent said maybe and 16 percent said no.
Importantly, of those who said they plan to visit this year, 60 percent will be returning visitors and 24 percent will be net new visitors.
An interesting correlation stands out when we consider past visits (64%), positive perception of Okanagan wines (64%), a highly positive perception of the Okanagan region compared to Burgundy and other popular wine areas, and consumer intent to return to the Okanagan (60%).
It seems like the majority of consumers who go wine tasting in the Okanagan leave with a positive impression. Most will also plan to return at some point.
Is there an opportunity to magnify promotion efforts by industry bodies to drive visitation, perception and growth?
What are your thoughts, and what is your experience with your wine club and tasting room? What can you do differently to grow your business?
Pinot Gris, or Pinot Grigio, represents a major business opportunity for wine producers. However, not all consumers and not all markets are the same. While a certain grape varietal may be, on the aggregate, preferred by consumers in a specific market, wine drinkers in another region may not have the same affinity for the grape.
Even within a market, consumer profile can greatly affect taste and wine grape preference. Among many parameters, this includes gender, age group, wine experience, background and overall food taste preferences.
We mined three years of QUINI DATA™ on Pinot Gris, for actionable consumer insight wineries can use. The analysis covered 33 popular wines and over 1000 individual consumer reviews. The interactive report focuses on wine drinkers in British Columbia, whose profile, overall, is reflective of the Pacific Northwest consumer.
Below are some highlights from the report, PINOT GRIS – Consumer Sensory Study of Household Name Pinot Gris.
- On average, male wine drinkers rate Pinot Gris wines slightly higher than their female counterparts.
- Usually, wine drinkers have lower expectations of Pinot Gris wines prior to tasting them, compared to other white wine varietals recorded on Quini.
- Older, more experienced generations have higher expectations of Pinot Gris wines, prior to tasting.
- Of the key sensory aspects of wine, it is usually the Mouth Appeal that may drag down a product’s overall rating.
- Longer Finish duration positively impacts Finish Quality perception and rating. For female drinkers, the effect is higher.
- Among the flavours detected by consumers when tasting Pinot Gris wines, products that drinkers associate with Lychee, Woody, Honey and Prune, typically score higher on Mouth Appeal.
- Drinkers prefer Pinot Gris wines that are straw in colour and clear throughout with no darker tone in the centre of the liquid, when looking at the wine in a glass.
- Consumers who detect extreme Sweetness or Alcohol in a Pinot Gris wine, most often may also record an impression of lower overall balance.
- Acidity in Pinot Gris wines often gets a less extreme score and does not impact the overall balance score as much.
Interact with a sample of the analytics and get more information on the report at this link.
Many wineries are diving deeper into the world of data to better understand their markets. In the world of wine, Cabernet Sauvignon is a critical arena where wineries big and small compete for market share.
We looked at the latest QUINI DATA™ interactive consumer sensory report on Cabernet Sauvignon to bring you key insight you can use today.
The report, CABERNET SAUVIGNON – Consumer Sensory Study of Household Name Cabernet Sauvignon – North America 2021, analyzes the feedback of more than 300 consumers, on 34 high volume leading wines, across 5 U.S. States and Western Canada. A total of 3,500 deep, rich wine reviews spell out opportunity for anyone paying attention to what consumers have to say.
While it is not the full report, and we highly recommend you obtain it for your teams, here are some important highlights.
- On average, male wine drinkers prefer Cabernet Sauvignon more than female consumers.
- West Coast wine consumers rate Cabernet Sauvignon wines higher than drinkers on the East Coast.
- Older generations record an impression of longer finish duration on Cabernet Sauvignon.
- Big sellers don’t necessarily mean consumers prefer them or even enjoy drinking them as much as other products. The report names several big sellers with the lowest wine ratings.
- The majority of Cabernet Sauvignon female drinkers rate the wine’s taste lower than its aroma.
- Consumers prefer Cabernet Sauvignon wines with relatively higher acidity, higher alcohol, and higher sweetness impressions.
- Consumers have a negative reaction to a sense of exaggerated tannin in a Cabernet Sauvignon, when compared to other aspects of the wine that together, including sweetness, alcohol and acidity, should work to offer a harmonious balance.
- Male drinkers, on average, prefer sweeter Cabernet Sauvignon wines than do female drinkers.
- Gen Z and Millennial consumers prefer ruby colored Cabernet Sauvignon. Gen X and Boomer drinkers lean towards purple shade colored wine.
- Among the most frequently detected flavours in Cabernet Sauvignon wines, consumers give higher ratings to Oak, Cherry and Rose. Conversely, on average, they tend to dislike Forest Floor, Smoke and Black Pepper.
Purchase or get more information about this report and other QUINI DATA™ Bronze reports, at this link.

As part of its mandate to support growth in the wine industry, the Ministry of Agriculture has a number of exceptional programs in place. One that is highly beneficial to BC wineries and wine industry associations is the B.C. Agrifood and Seafood Market Development Program.
Quini is a pre-qualified consultant to provide Market Research Services to BC wineries and wine industry associations, under the program.
As a B.C. based wine producer or industry association, a winery can today verify its eligibility and apply for funding for sensory and attitudinal market research projects, led by Quini, for the 2022 program year, at the link above. The application process opens November 24, 2021, with the final project submission deadline being December 9, 2021.
Having successfully helped BC wineries with their applications in 2021, Quini's team is happy to discuss your market research goals and assist you with the application process.
Approved projects may receive funding subsidy from the Investment Agriculture Foundation of B.C. of up to 50 percent of the cost of research, for a total of CAD $20,000 dollars annually for wine producers and up to $75,000 for industry associations, boards and councils.
Interested wineries or associations can email Quini with questions or request assistance with the application process, at sales@quiniwine.com.
Quini’s industry-leading consumer sensory and attitudinal market research data and technology solutions enable wine producers and associations to evaluate and analyze products, and understand target consumers and new markets, with unique, proprietary data and analytics accessed on-demand, with new insight delivered approximately at 33 percent or less of the time and cost of traditional market research.
We are proud to have served and to call several BC wineries Quini clients. We look forward to making your next market research project too, possible and highly successful.
Contact Quini at sales@quiniwine.com or via telephone at 604-218-9484 for more information and for assistance with your research grant application.
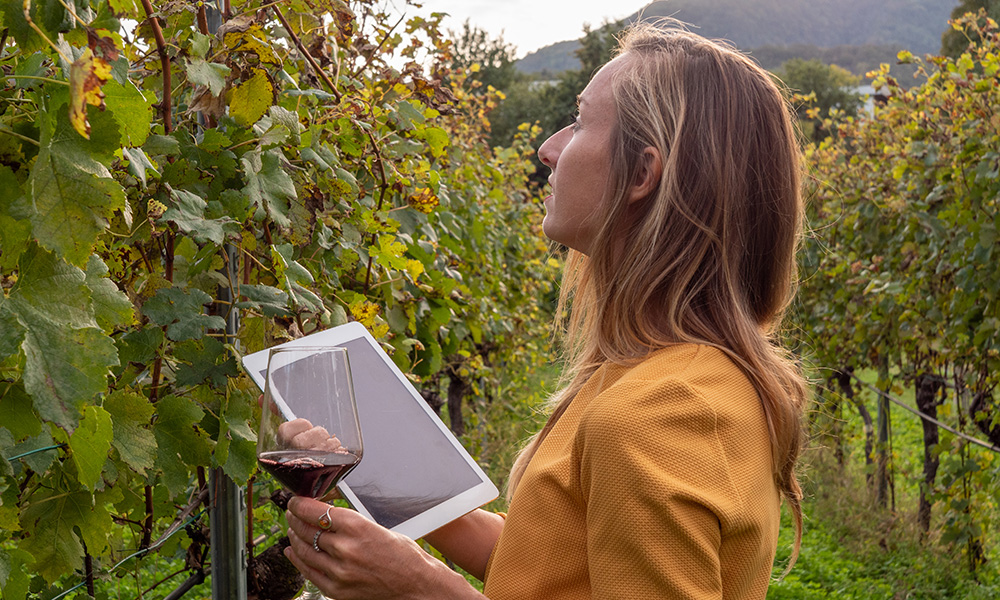
Photo credit: UBC Okanagan News
UBCO research explores next generation of wine appreciation
October 19, 2021
By: UBC Okanagan News
Read the article at UBC Okanagan News
Photo Credit: UBC Okanagan News
It’s wine bottling season and new research from UBC’s Okanagan campus shows that younger sippers should be inspired, rather than lectured, during their tasting experience.
The international study, published in the Cornell Hospitality Quarterly, found that millennials and generation z—those between the ages of 18 to 40—appreciate wine more when they define it on their own terms and with the support of technology instead of learning with traditional terminology and analysis.
“The traditional way of teaching wine appreciation using a verbal lexicon is turning off and boring young consumers,” says Annamma Joy, professor in the Faculty of Management and co-author of the study. “With their spending power, it makes sense for winemakers to adapt the experience to better engage them as new customers.”
She says that these findings provide key marketing insights to the $9 billion Canadian wine industry.
Dr. Joy and her colleagues from Cornell University first tested how a holistic tasting approach compared to a traditional one with young wine drinkers with an average age of 24. The traditional group analyzed the wine’s taste by deconstructing flavour profiles and writing detailed descriptions. On the other hand, the holistic group, learned to appreciate wine tastes by drawing images and discussing them. Both of the groups enjoyed learning about wine, but those who participated in the holistic group engaged in a deeper, more thoughtful way.
“While new consumers might find the analytical approach effective at teaching them how to differentiate tastes, the holistic approach allows them to create a more emotional connection to the wine—bringing meaning beyond the test environment,” says Dr. Joy.
The next research step was to determine what references these young consumers use for wine information, for both new experiences and follow-up education. Generational differences in wine education were analyzed using the digital platform, QUINI. The number of online interactions increased with younger generations—millennials (24 to 40 years) engage more than generation x (41 to 56 years) and baby boomers (57 to 75 years). Also, as generation z (6 to 24 years) consumers reach drinking age, their online activity increases. The researchers also noted that the type of information preferred differs between generations, with older ones preferring traditional education and newer consumers turning to experiences such as wine-tastings and wine tourism.
“Our research shows that younger consumers are interested in wine, but their approach is different than what their parents experienced. Making learning fun and using digital platforms can increase their appreciation of wine and provide a positive path to developing future wine consumers,” says Dr. Joy.
“Wine needs a great story to attract the millennials and younger generations. If you don’t have one, you may be left with sour grapes.”