

InnoVint's NEW Interactive California Grape Crush Report
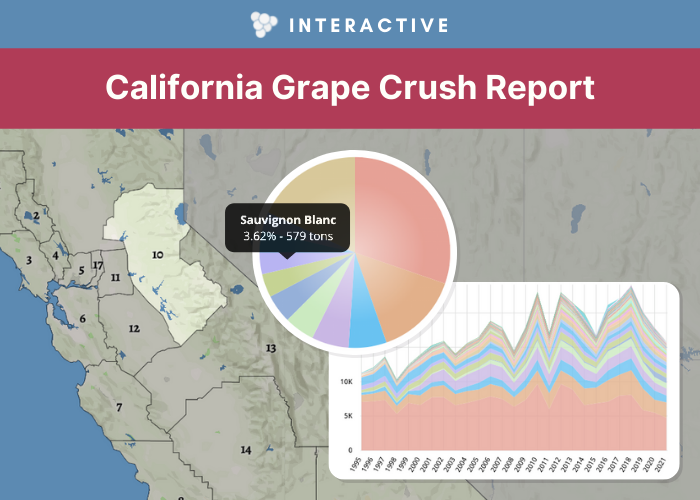
InnoVint is excited to present a brand new way of visualizing the California Grape Crush Report data. Previously only available in PDF, this interactive report allows viewers to study trends since 1995. Dig into 27 years of data across all 17 districts!
Our unique visualization tool shows you cool data instantly, like:
- Total tons crushed in your district
- Most common varietals in your district
- Average price per ton by varietal and by district
We hope this app becomes a great resource for analyzing varietal trends over time. Check it out!
Where do we get the data?
The information included in InnoVint’s Interactive California Crush Report is pulled from the USDA’s published annual reports. We’ve taken their data across many years and aggregated them into one interactive database.
00