InnoVint’s Custom Reporting functionality allows you to create dynamic, interactive views of your data across all wineries, wine lots, and associated data right inside of InnoVint.
We designed Custom Reporting to empower users with a personalized and immersive data analysis experience. Unlike conventional static reports, this dynamic document invites users to actively engage with the data, unlocking a new level of insight and decision-making. Easily highlight only the most important information so you can cut through the noise and focus on what really matters - making and selling great wine.
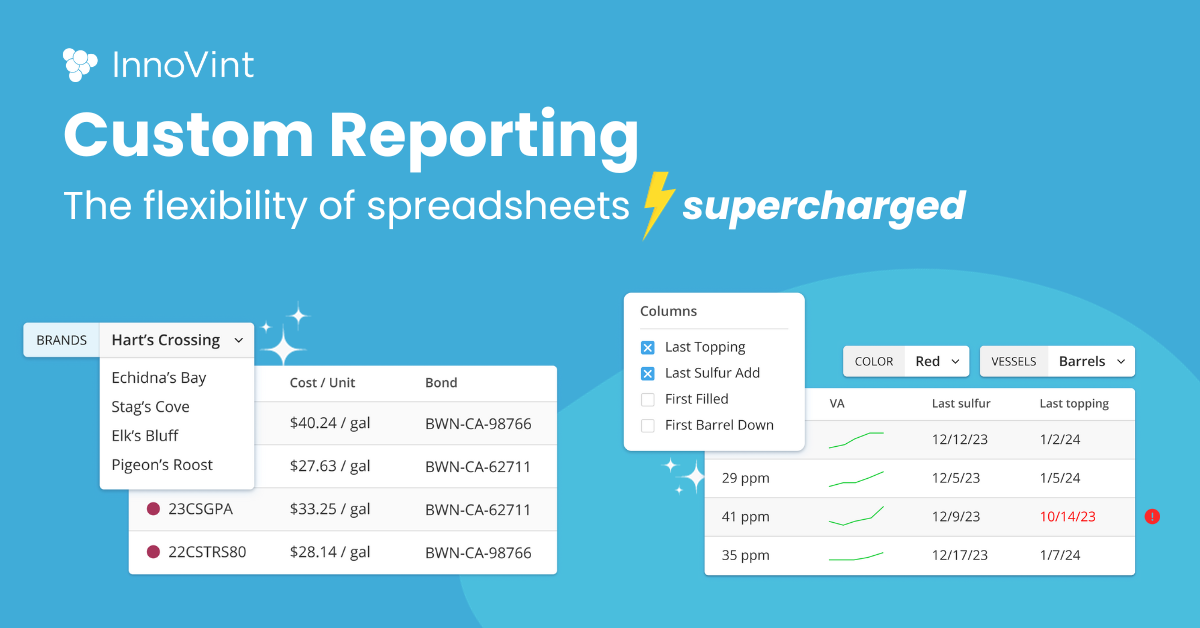
The Wine Industry's Most Advanced Reporting Tool
Complete customization: Almost every aspect is customizable. Effortlessly search, sort, and filter to create a view that meets your specific needs.
Enhanced flexibility: InnoVint’s Custom Reporting takes the flexibility of spreadsheets and supercharges it with the power of InnoVint. Rearrange and pin columns, and group data to generate the perfect view.
Unmatched reporting power: Thanks to our powerful new database technology underneath, experience lightning-fast reporting no matter the volume of data processed.
Crowdsourced functionality: Your input drives our product. Need a specific data point? Just let us know!
Real-World Use Cases to Improve Winery Operations
The sky is the limit to how you can utilize Custom Reports in your day-to-day operations. With Custom Reporting, there are unlimited ways to view and explore your data… Let’s look at a few real-world examples that can be used throughout your winery to make faster, more data-driven decisions.
Easy QA checks for production and aging processes.
Your winemaking and production teams need to consistently monitor wines at every stage. Having a quick view of the current status of each wine lot - for example, when the last topping happened or if analysis is out of range - makes it much easier to assess wine health and manage routine maintenance.
Track current and total costs, your way.
Finance professionals and winery owners can quickly group and visualize cost data in new ways, including by vintage, vessel, lot stage or wine program. The ability to easily audit cost allocations with more granular report options means more accurate data to make informed business decisions.
Manage all of your brands and locations in a single interface.
Having access to a consolidated view of all of your brands and locations - including in-process wine and COGS - is important. But having a dynamic view, with the ability to filter down to any subset of your data with one click, is invaluable. As brand portfolios inevitably change and locations are added or removed, InnoVint makes it easy to manage and maintain a consolidated view.
Better Data = Better Decisions
At InnoVint, we believe that access to better data is key to making better decisions across your winery, in addition to improving efficiency. We are excited to deliver these improvements to our users and continue to invest in making data-driven decisions a reality for all wineries.
If you’re interested in learning more about InnoVint’s reporting and analytics capabilities - or want an overview of the platform - reach out to us at sales@innovint.us or request a demo!